iiCreator Flow Chart
You can now provide additional information to the flow chart for presentation use by adding interactive features to the flow chart. Mouseover description box can be easily added to the chart without coding, and created flow chart can be instantly uploaded / shared to others.
Add information box
Mouseover information box can be added to the chart by first drawing rectangles, can then insert mouseover content to the rectangles without coding in the software panel.
Insert image to the chart
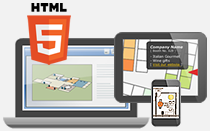
Images, videos, external links, and other multimedia can be easily inserted to the chart as the information box supports HTML code.
Customize popup box style and size
Popup box style (e.g. font style, size, color) can be customized without coding in the software, and wide range of styles and colors can be selected to suit your map style. Besides, you can customized individual popup box size by adding HTML code (e.g. box size of "Edit image" has been customized by adding "<li>...</li>")